

Research demonstrates that AmeriCorps in Rhode Island benefits its members as much as it does the communities they serve.

Impact of AmeriCorps on RI Communities
At the request of ServeRI, the Rhode Island Longitudinal Data System conducted a study of AmeriCorps alumni, bringing together state data on AmeriCorps participation, workforce participation, and higher education. This webpage includes the full text and images of the report published October 2024.
AmeriCorps plays a critical role in advancing opportunities for both service recipients and volunteers in Rhode Island. Primarily operating in economically disadvantaged urban areas, AmeriCorps members provide essential services to those in need. Volunteers from these communities gain access to education and employment pathways that may otherwise be inaccessible.
Through Segal Education Awards and extensive training, AmeriCorps leverages federal funding to help thousands of Rhode Island AmeriCorps members in completing higher education, entering the workforce, and contributing to the local economy. In addition to gaining valuable skills, these individuals remain civically engaged and contribute to the state’s social sector.
The Value of Service in Rhode Island
AmeriCorps is a federally funded program addressing critical needs in education, the environmental protection, and public safety. Rhode Island has benefited significantly from AmeriCorps, ranking 7th in the U.S. per capital participation as of 2019, while Providence ranks 2nd nationally among small cities (footnote 1). Since program’s inception in 1994, over 8,500 Rhode Island residents have contributed approximately 12 million service hours, earning more than $30.4 million in education awards (footnote 2).
Several features distinguish national service programs like AmeriCorps from other volunteer initiatives:
Federal funding is leveraged to address local issues.
Structured training programs equip volunteers with practical skills, enhancing program effectiveness.
In addition to a living allowance, members receive student loan deferment and a post-service Segal Education Award, which can be used for higher education expenses or to repay qualified federal student loans.
Service terms range from 300 hours to full-time commitments exceeding 1,700 hours. Volunteers serving 300 or more hours, classified as high-intensity volunteers, are more likely to provide substantial value and benefit from their service.
AmeriCorps awards federal funds to the Rhode Island Department of Education to administer local programs approved and supported by Serve Rhode Island (ServeRI), the Rhode Island Commission for National and Community Service.
This report focuses on a key group that has not only provided a huge benefit to Rhode Island communities through their service but who are positioned to make an ongoing impact in the state. The cohort includes the 506 AmeriCorps members who:
Served in Rhode Island within the past 5 years.
Were born in 1985 or later.
Have served at least 300 hours in one year (high-intensity volunteers).
Of the 506 individuals in this cohort, 466 were found in RILDS’ higher education data holdings. Figure 1 demonstrates that the majority enrolled in postsecondary education during or between their AmeriCorps terms, countering the misconception that AmeriCorps primarily serves individuals on a “gap year” before college. Additionally, most members in the cohort, including those from in-state and out-of-state, attended college in Rhode Island. Of the members from this cohort who were matched in the RILDS database, 66% attended a public institution and 79% attended a 4-year institution.

AmeriCorps Service Provides Pathways to Higher Education and Careers
Figure 1: Cohort postsecondary enrollment timeline

Figure 2: Cohort postesecondary enrollment outcomes.
The cohort’s most recent higher education enrollment data indicates that Rhode Island benefits from AmeriCorps members who remain in state to pursue further education. Seven of the top ten institutions attended by this group are in Rhode Island, with the top three being public institutions. Many members likely utilize their AmeriCorps Education Award at these institutions. Between 1994 and 2020, over $12 million has been paid to Rhode Island higher education and loan holding institutions (footnote 3).
Beyond education, AmeriCorps alumni often remain in Rhode Island for employment. Figure 3 shows that the majority of alumni (those who have completed their terms of service) are employed in the state up to three years post-service, contributing to a net “brain gain” effect, with skilled worker from both in-state and out-of-state boosting the Rhode Island workforce. Roughly one out of two members remain employed in Rhode Island four years after completing their service.
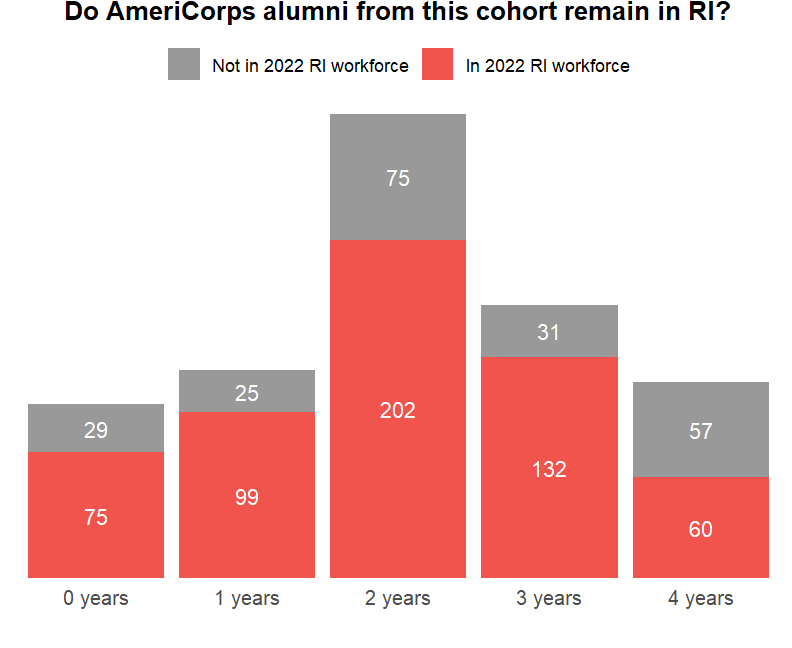
Figure 3: Cohort alumni by 2022 RI workforce participation and years since last service term
Figure 4 highlights that the top three industries employing alumni are Educational Services, Health Care and Social Assistance, and Other Services (except Public Administration). The last category, a small industry in the state is probably more prevalent among this group because it includes sectors such as grant-making, advocacy, and religious services. Notably, 55% of alumni work in Educational Services, which aligns with the finding that most of the cohort served in AmeriCorps programs focused on education.

Figure 4: Most common industries of employment of AmeriCorps cohort
Figure 5 displays the inflation-adjusted median annual wage of this cohort by age, compared to a comparison cohort. The comparison cohort was limited to individuals born between 1985 and 2004, who attended any Rhode Island high school that members of the AmeriCorps cohort also attended. On average, AmeriCorps members surpass Rhode Island’s living wage by the age of 24. As shown in Figure 5, members of the AmeriCorps cohort consistently out-earn their counterparts beginning at age 23.

Figure 5: Wage outcomes of AmeriCorps cohort.
Members come from the Communities they Serve
This report focuses on a key group that has not only provided a huge benefit to Rhode Island communities but is also well-positioned to make a lasting impact within the state. The cohort includes the 506 AmeriCorps members who:
Served in Rhode Island within the past 5 years.
Were born in 1985 or later.
Completed a minimum of 300 hours in one year (high-intensity volunteers).
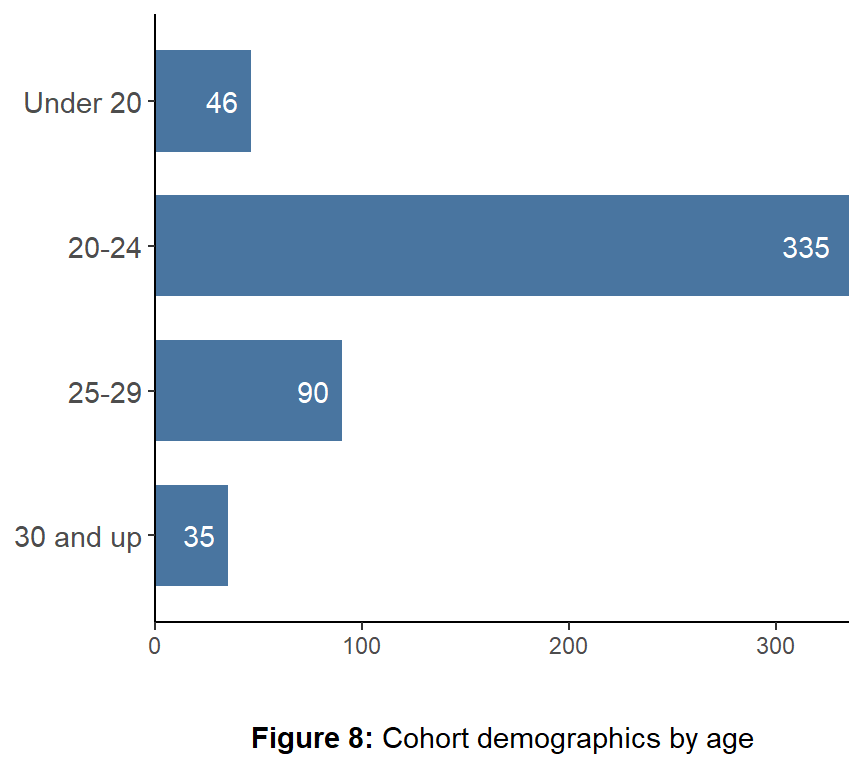
Figures 6-8 present the demographic breakdown of this cohort by race/ethnicity, gender, and age. Of the 506 members in this cohort, 47% identify as White, 23% identify as Hispanic, 12% identify as Black or African American, and 8% identify as Asian or Asian American. These figures were derived from a dataset where race and ethnicity are combined into a single variable, so individuals may be represented in multiple categories. In comparison, U.S. Census Bureau estimates for 2022 indicate that the racial composition of Rhode Island was 83% White, 9% Black or African American, and 4% Asian, with ethnicity reported, showing that 18% of Rhode Islanders identify as Hispanic or Latino.
Roughly two out of three members of the cohort identify as female; consistent with the U.S. Bureau of Labor Statistics’ 2022 estimate that 66% of the private nonprofit workforce, is female. Lastly, two out of three members of the cohort were between 20-24 years old at the start of their AmeriCorps service.
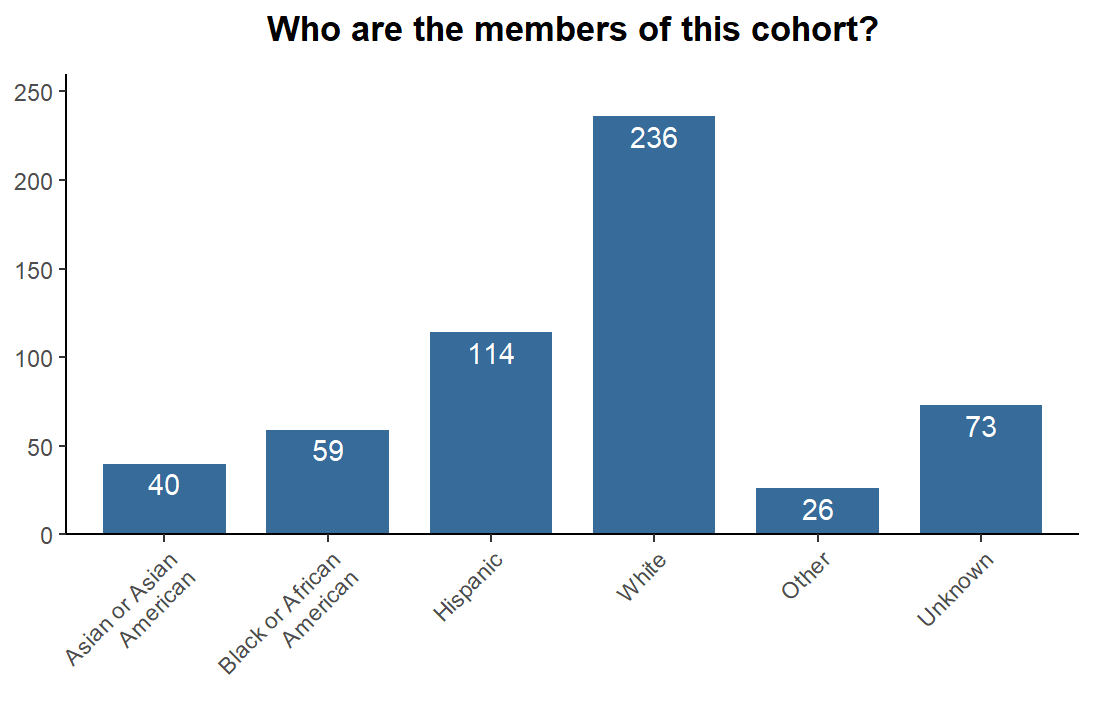
Figure 6: Cohort demographics by race

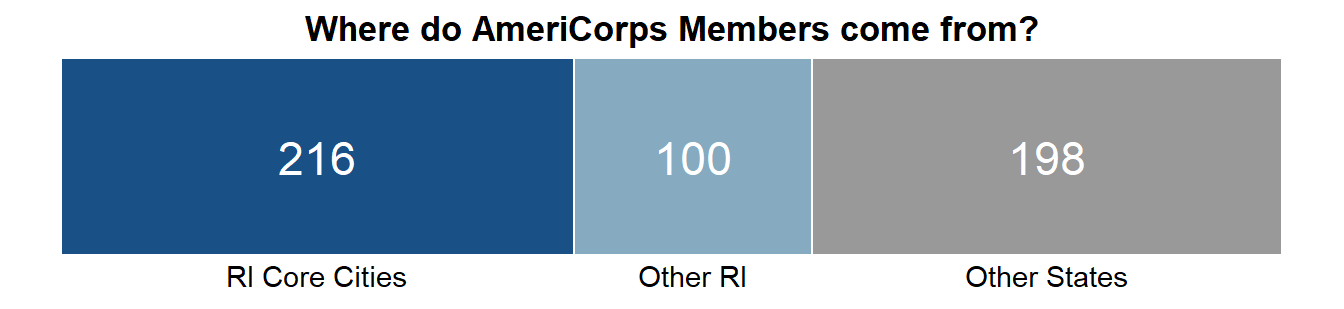
Rhode Island attracts AmeriCorps members from both within and outside of the state. Of the in-state members, a substantial proportion originates from neighborhoods served by AmeriCorps programs. The largest subgroup, comprising 53% of the cohort, hail from Providence, with Woonsocket and Pawtucket - two other urban areas with high rates of child poverty - following in size.
Do AmeriCorps members focus on areas of greatest need?
Figure 9 shows the geographic distribution of the cohort’s place of origin. By recruiting from these areas, AmeriCorps engages members uniquely equipped to address local challenges. Far from the concern that only privileged individuals disconnected from these communities can afford to serve, these volunteers are largely made up of individuals who are most likely to benefit from the training and funding AmeriCorps provides.
An analysis of the K-12 districts attended by in-state members further supports this. The majority of schools feeding into the AmeriCorps program are in Providence, the state’s largest and one of its most economically disadvantaged cities. Other prominent feeder districts are from lower-income urban areas. The most common districts attended by members of this cohort are Providence (53), Woonsocket (16), Cranston (11), and All Other Districts (82). It is important to note that only 32% of this cohort appears in Rhode Island Department of Education (RIDE) enrollment data, with the remaining portion of the cohort’s K-12 education records unknown.
With 10.8% (footnote 4) of Rhode Island’s population living in poverty and the state’s unemployment at 3.2% as of December 2023 (footnote 5), the demand for volunteer services is undeniable. However, the degree of need varies significantly across neighborhoods.
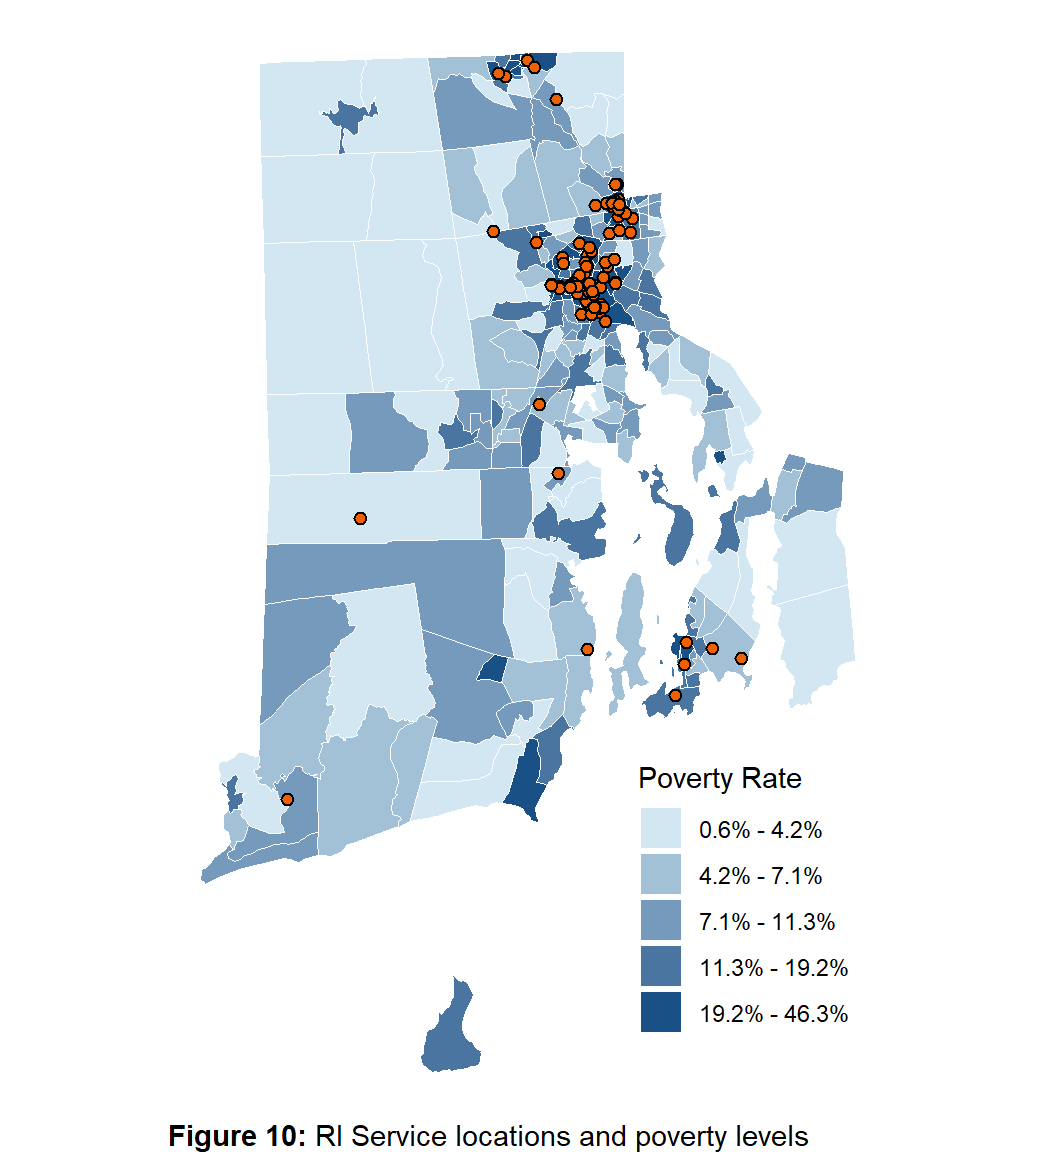

Figures 10 and 11 highlight the concentration of AmeriCorps programs in Rhode Island and Providence. Service efforts are focused in urban areas where poverty is most concentrated, such as Providence and Central Falls.
AmeriCorps programs also prioritize services with the greatest potential impact. Children are especially vulnerable to poverty, with 12% of Rhode Islanders under age 18 living below the federal poverty line (footnote 6), and rates nearing or exceeding 30% (footnote 7) in Providence and other urban areas. The majority of Rhode Island AmeriCorps programs focus on early childhood education, K-12 academic success, and college access, equipping children with the education necessary to secure good jobs and build wealth.
About this Report
This report was developed by the Rhode Island Longitudinal Data System (RILDS) Center. The report is based on data stored in RILDS as of April 2024.
Additional information regarding the data sets used in this report:
Rhode Island Department of Education (RIDE) - K12 Enrollment Data
Records covering terms Fall 2004 through Spring 2022.
Data set limitation: Only students who attend the Rhode Island public school system are included in this data.
AmeriCorps/ServeRI via RIDE - ServeRI Program Participation Data
Records covering dates September 1, 2010 through September 1, 2022.
Office of the Postsecondary Commissioner (OPC) – Postsecondary Enrollment and Completions Data
Records covering terms Spring 2007 through Fall 2023.
Data set limitation: Only students who attend one of the three RI public institutions are included in this data.
National Student Clearinghouse (NSC) via RIDE and OPC - Postsecondary Enrollment and Completions Data
Records covering terms Spring 2010 through Fall 2023.
Department of Labor and Training (DLT) – Employment & Wage Data
Records covering quarters Q1 2011 through Q4 2022.
Data set limitation: Only employees of employers that pay into RI unemployment insurance are included in this data.
U.S. Census Bureau – American Community Survey (ACS) Poverty Data (table C17002)
Records covering calendar year 2022.
All aggregated values below ten (10) were suppressed for this report.
